How to use SleekFlow Conversation Analytics for better sales support?


The way customers talk to businesses has changed—they want the speed of WhatsApp, Messenger, and TikTok.
But for sales managers, this shift brings a massive challenge: how do you manage thousands of fast-paced conversations when you are blind to your peak traffic hours, unsure which channels are performing, and guessing at your team’s actual workload?
Whether you need to justify a larger headcount or understand if your team is drowning in sales inquiries vs. support requests, you need more than just an "unread" list.
That is why we are thrilled to introduce SleekFlow Conversation Analytics, a powerful new dashboard that turns your conversation volume into actionable operational insights.
Before we dive into how this new dashboard works, let’s look at why relying on native app insights is no longer enough to run a fast-moving sales team.
Why are native WhatsApp analytics not enough?


You are likely managing your team’s performance using the native analytics provided by WhatsApp Business, Instagram, or TikTok. They offer a surface-level view of activity, but they hide the operational data you need to drive growth.

1. A clean inbox creates an illusion of progress
You might look at your WhatsApp inbox and see zero unread messages, but does a "read" status equal a qualified lead or a closed deal? Absolutely not.
You are left guessing about your team's actual efficiency: Are they actively working through a pipeline, or are they just clearing notifications to make the badge disappear? Without a clear distinction between a viewed message and a responded conversation, you are flying blind on productivity.
2. Staffing based on guesswork, not facts
Beyond the volume of messages, there is the critical question of when they occur. To run an efficient operation, you need to align your human resources with customer demand.
However, dissecting workload by the hour is nearly impossible within native messaging apps. Most platforms provide a static daily count, masking the nuances of your traffic flow.
Consequently, staffing becomes a game of intuition rather than data. You risk overstaffing quiet Tuesday mornings while leaving high-value leads waiting during an unexpected weekend rush—simply because the data wasn't there to warn you.
3. Channel silos make reporting difficult
Finally, there is the challenge of fragmentation. WhatsApp analytics live in one tab; Facebook Messenger insights live in Meta Business Suite; TikTok is in another silo entirely. Each platform uses different metrics and visualizes data differently.
Trying to understand which channel drives the most volume—so you can allocate the right budget and attention—often feels like comparing apples to oranges.
This forces you into a manual, time-consuming loop of exporting spreadsheets and stitching together disparate numbers just to answer a simple question: "Where are our customers actually talking to us?"
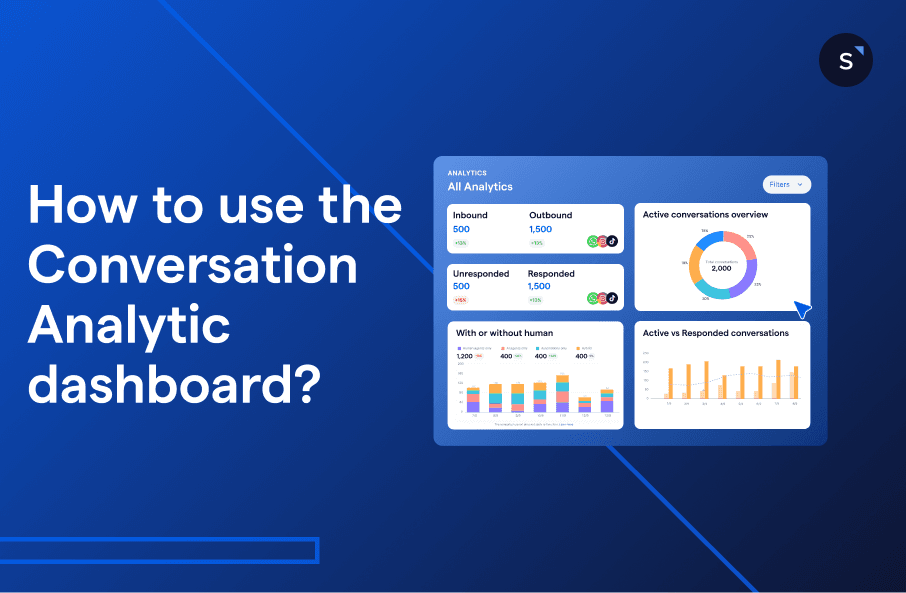
How to turn conversation volume into actionable insights?
SleekFlow turns scattered chat activity into clear insights you can act on. Each part of the dashboard empowers managers to make smarter, data-driven decisions.
1. Get a clear overview of your daily workload

SleekFlow provides a snapshot of your Active Conversations so that you can see the overall workload at a glance.
You can also apply filters to isolate specific teams or see individual workload. The snapshot separates volume by Inbound vs. Outbound and Respond vs. Unresponded. It allows you to identify which team members are proactively reaching out to prospects and how responsive they are to incoming queries.
Furthermore, by comparing the current period with the previous week or month, you can spot macro trends immediately. Is that spike in traffic a temporary blip or the result of a successful new marketing campaign?
If the numbers look unusual here, take it as a prompt to dig deeper and find out what’s driving the shift with more insights below.
2. Pinpoint your traffic sources across messaging apps
Once you know your volume, the next logical question is: Where is it coming from? SleekFlow splits your traffic data into two dimensions.

Channel breakdown: Identify which platforms are generating conversations. Is your new TikTok campaign driving a surge in queries, or is WhatsApp still your primary engagement tool?
Inbound vs outbound distribution: Understand the nature of your workload. Are your teams drowning in inbound leads (customers coming to you), or is the volume driven by outbound follow-ups (your team chasing leads)?
With that, you can make strategic adjustments:
Improve speed-to-lead: If a specific sales channel shows a sudden spike in inbound leads, shift more reps to that channel. Reducing wait times here directly impacts your conversion rates.
Validate marketing ROI: If you see Instagram generating more inbound conversations than Facebook, you have data to share with your acquisition team. It’s a clear signal that organic social is performing and is worth further investment.
3. Optimize staffing with the conversation open & closed heatmaps
Volume alone doesn’t show when you need more staff. By using the Conversations within or outside business hours chart, you can compare customer demand to your team’s coverage.

With heat maps, you’ll visualize when conversations are opened (customer demand) versus when they’re closed (team capacity) across the day and week. This makes it easy to spot alignment issues:
Healthy: Opened and closed conversations both peak during working hours. Your team is keeping up with demand.
Overwhelmed: Opened peaks during the day, but closed peaks late at night, showing the team is catching up after hours.
Uncovered: Opened peaks outside business hours with little closing activity, signaling missed opportunities from after-hours buyers.
Recognizing these patterns helps you adjust shift schedules or build AI chatbots to capture and qualify leads when your human agents are offline.
4. Balance human effort with automation ROI
Increasing headcount is not always the best answer to high volume. Many conversations are simple or repetitive and don’t require a human.

The Responded conversations, with or without human view, break down exactly who is doing the work: Human agents, AI Agents, Automation, or Hybrid workflows. This metric helps you:
Validate your automation: If you see the Automation or AI segment growing, while human volume stabilizes, it means your chatbots are successfully deflecting routine queries—freeing your sales team to focus on high-value conversations.
Spot over-reliance on humans: If your volume spikes and the Human agent bar spikes with it, your team is likely getting bogged down in repetitive admin work that could be automated.

To verify if your current setup is actually working, cross-reference this with the Active vs. Responded conversation chart. This tells the story of your operational health:
Healthy pace: Responded conversations track closely with the rise in Active conversations. Your operation is agile and responsive.
Under pressure: Active conversations skyrocket, but Responded creates a flat line. Your setup hit its ceiling.
Use these insights to optimize your operation, whether by hiring more staff or by improving your routing rules to let AI handle the first layer of qualification.
Benefits of using SleekFlow Conversation Analytics
SleekFlow Conversation Analytics gives managers a clearer understanding of how their messaging operation actually performs, so decisions are shaped by real data rather than assumptions. With better visibility across workload, timing, and response patterns, teams can run their day-to-day operations with far more confidence and stability.

Understand operational health at a glance
You instantly see how many conversations are active and how they’re progressing, making it easier to spot early signs of rising workload before it affects response quality.
Know where to focus your team’s time and effort
Channel-level insights highlight where conversations are coming from, helping you direct your team’s attention to the platforms that matter most and align resources more effectively.
Optimise staffing based on real customer behaviour
Understanding when customers typically reach out helps you plan shifts more accurately, reduce unnecessary idle time, and ensure better coverage during busy windows.
Measure how much automation and AI are supporting your team
Clear visibility into responded conversations shows how much work is handled by automation or AI, giving you a better sense of whether your workflows are easing pressure or need adjustments.

Turn your messaging data into decisions you can act on
Get a clearer view of how your conversations flow and make business decisions with confidence.
{{__phrase_share-article__}}